

Metrics
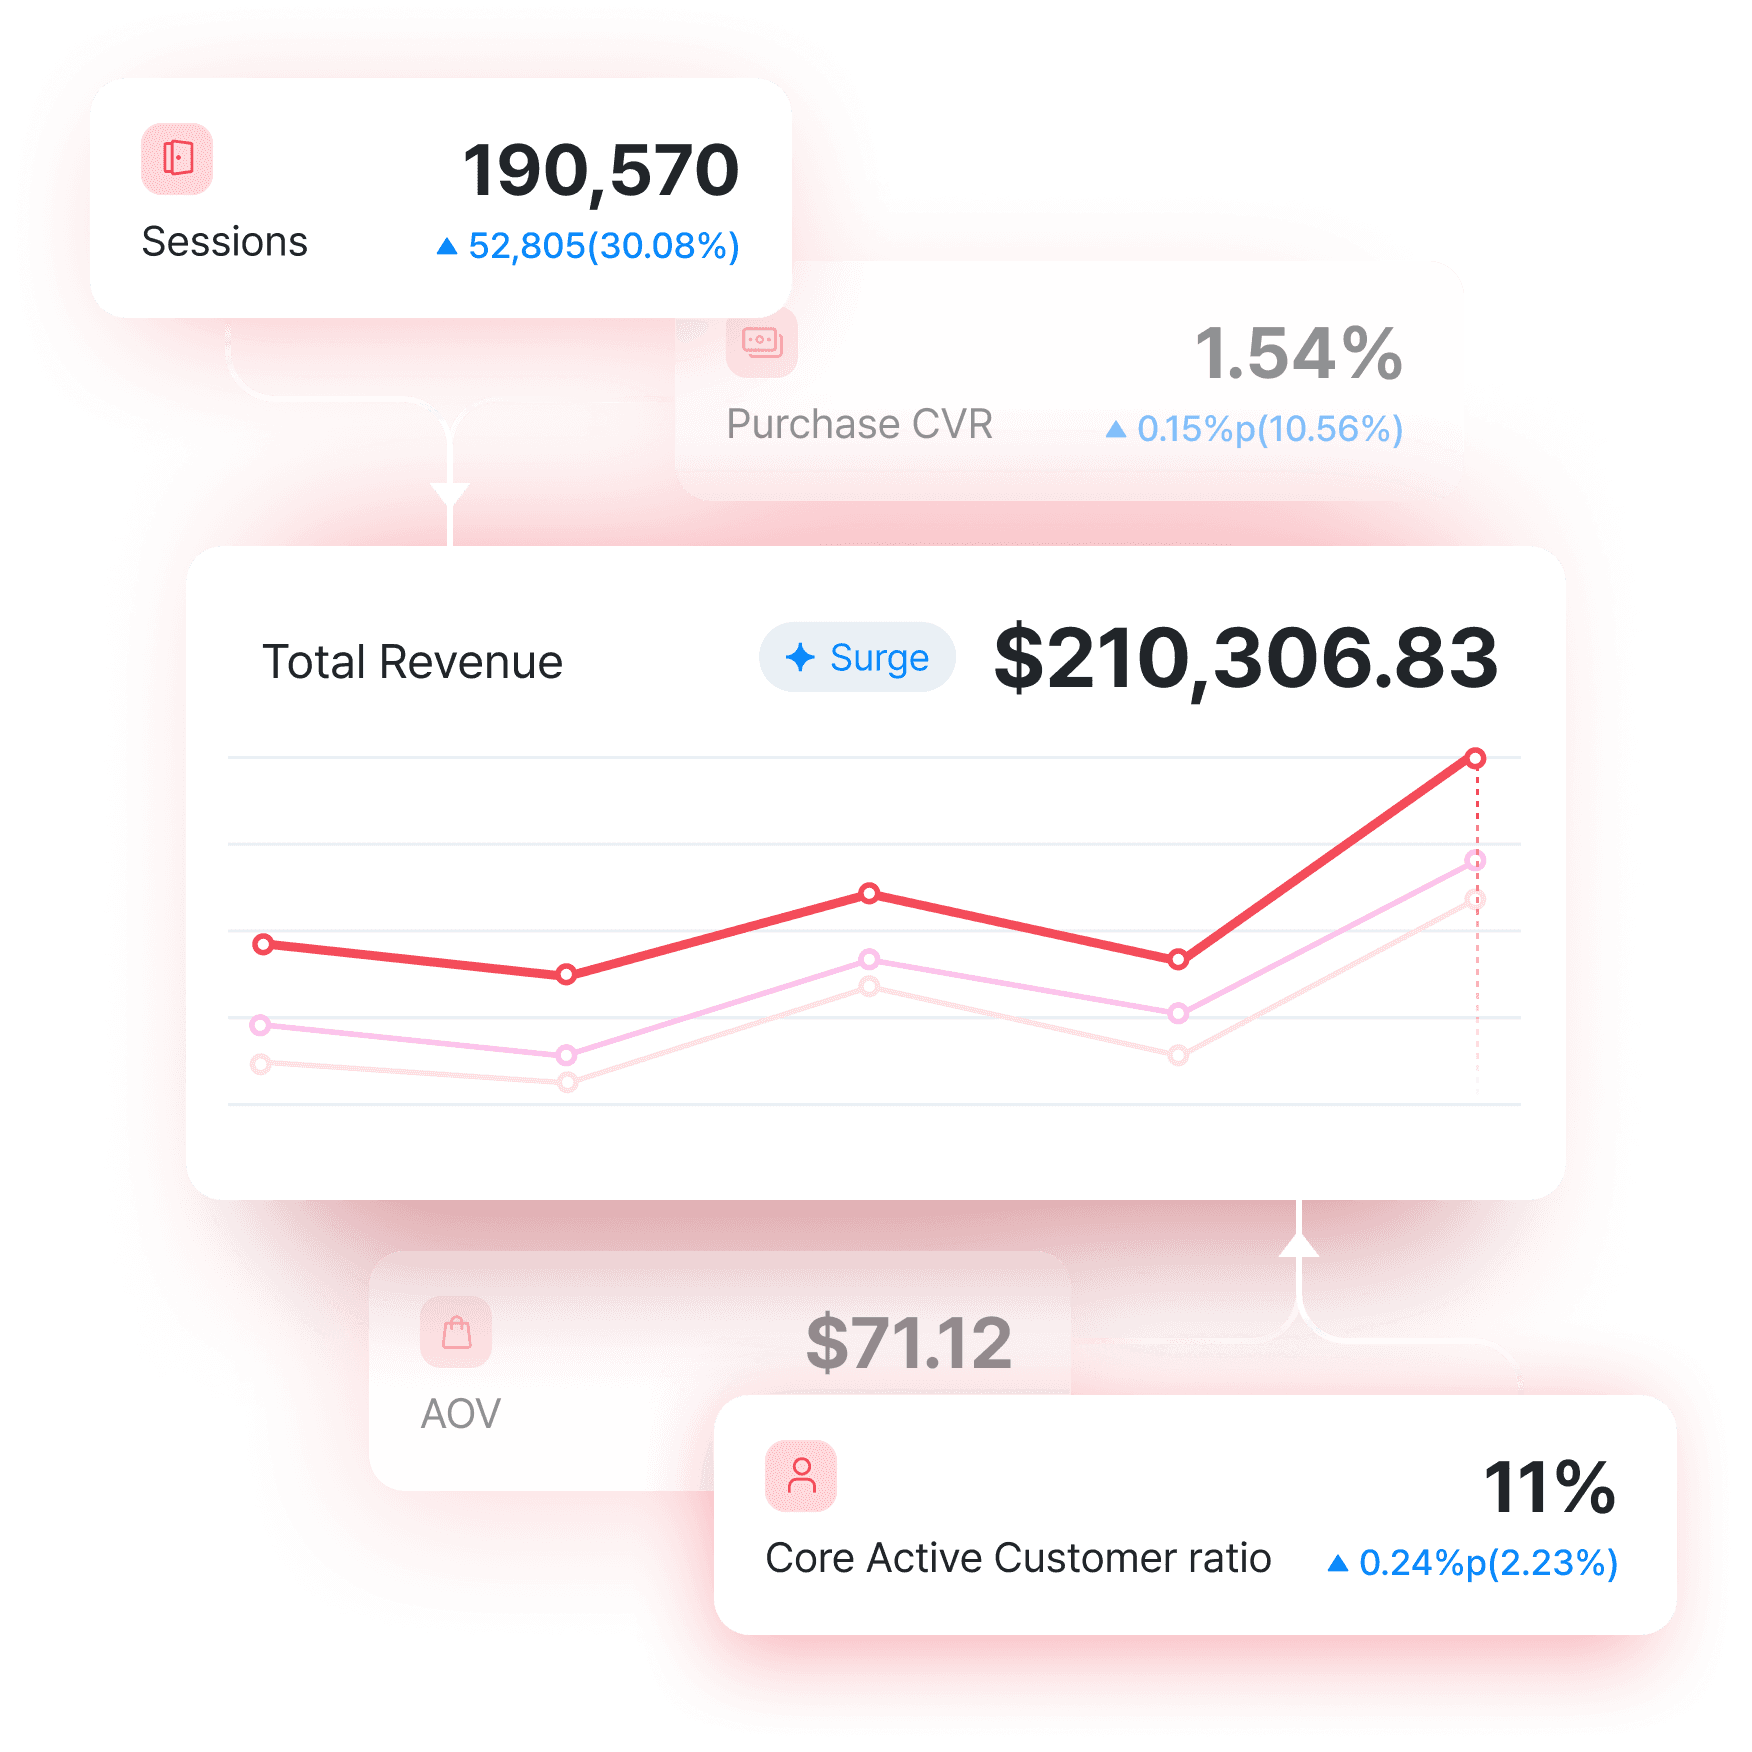


“For less experienced marketers, it can be difficult to know which metrics matter most. Datarize solves this with a “Core Metrics” dashboard that makes it easy to understand the site’s overall health at a glance"
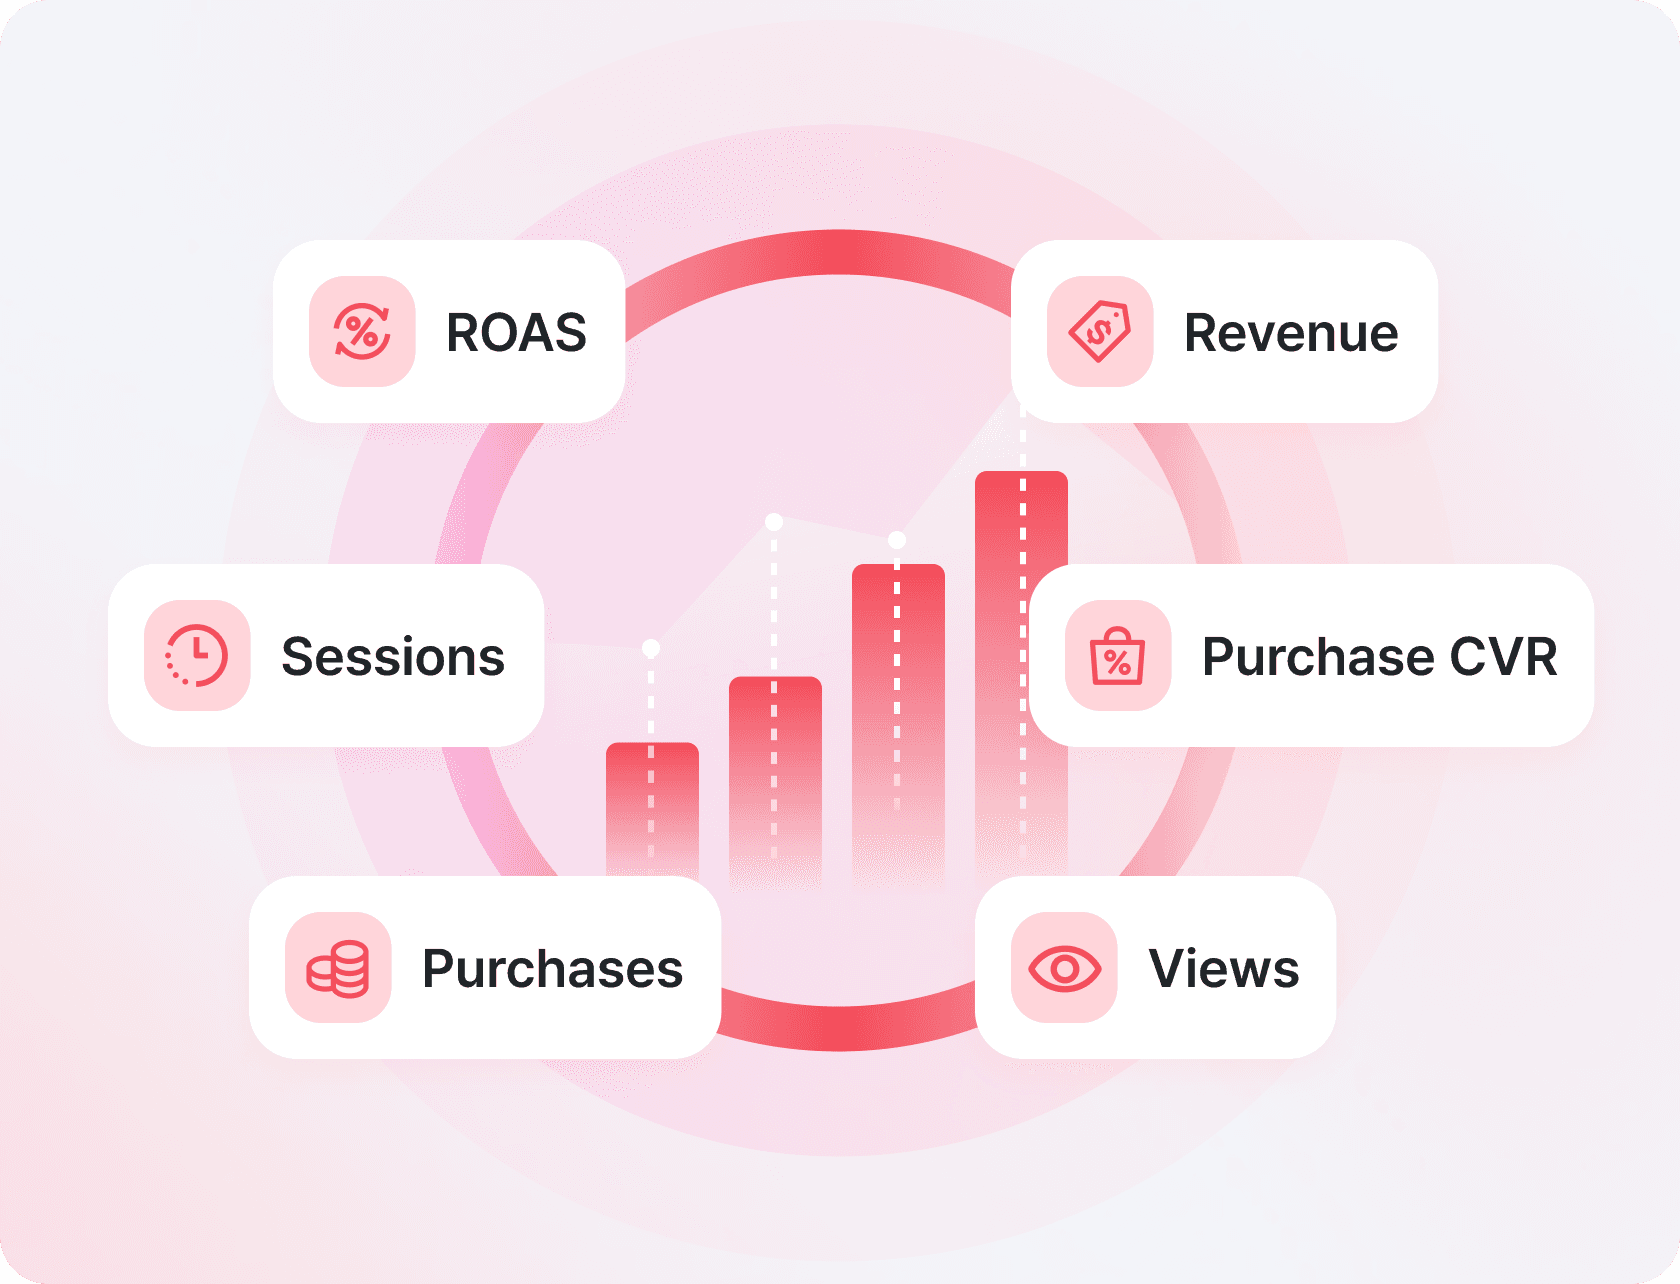
Use Core Metrics to track revenue, sessions, purchase CVR, and AOV—automatically broken down by user type for clearer insights.

See exactly where your revenue begins—identify the acquisition channels and campaigns that bring in your highest-value customers.

FAQ
Q1. How often is Datarize data updated?
Q2. Can I view multiple acquisition channels together?
Q3. How do I figure out why sales dropped?
